Categories
STAT ReportsPublished April 30, 2026
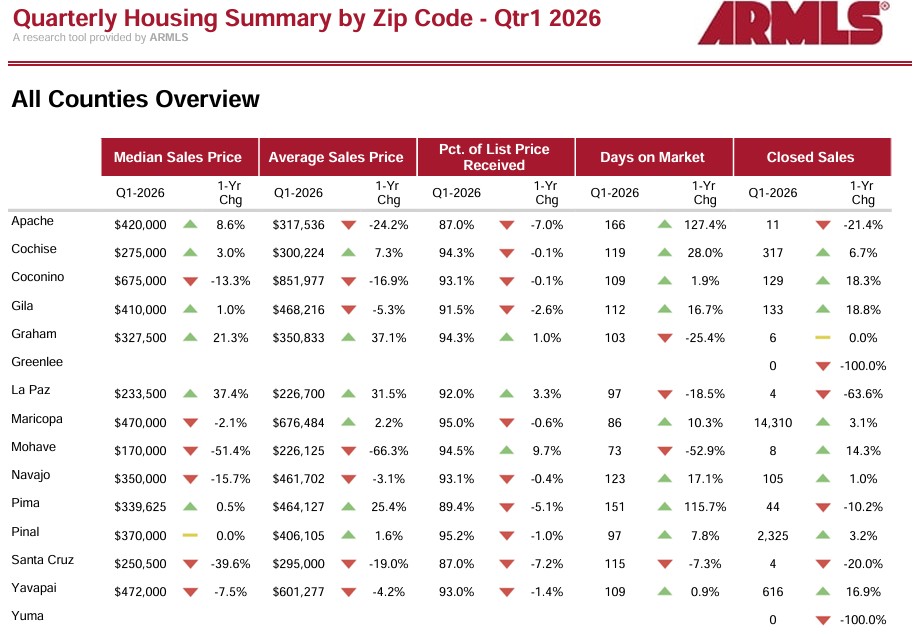
2026 Quarterly Housing Summary - Q1

Market Report | ARMLS Data
Arizona Home Sales Hold Steady in Q1 2026 — But the Market Varies Widely by County
April 6, 2026 • Data sourced from ARMLS / RapidStats
| Maricopa closed sales 14,310 +3.1% YoY |
Maricopa median price $470,000 -2.1% YoY |
Pinal closed sales 2,325 +3.2% YoY |
Highest median price $675K Coconino County |
Arizona’s for-sale housing market kicked off 2026 on a mixed note. The state’s two largest markets — Maricopa and Pinal counties — posted modest sales growth year-over-year, suggesting continued underlying demand even as prices in some areas softened. However, rural and outlying counties painted a much more fragmented picture, with wide swings in both pricing and transaction volume.
Maricopa and Pinal anchor the market
Maricopa County, which accounts for the vast majority of statewide activity, logged 14,310 closed sales in Q1 — up 3.1% from a year ago. Inventory held nearly flat at just under 19,000 homes, and months of supply tightened to 3.1, down 8% year-over-year. Median prices dipped slightly to $470,000, while homes still fetched about 95% of their asking price. Pinal County mirrored this stability, with 2,325 closings and a flat median at $370,000.
Luxury markets under pressure
Coconino County, home to Flagstaff and Sedona, carries the state’s highest median at $675,000 — but prices fell 13.3% year-over-year, suggesting some cooling after years of sharp appreciation. Similarly, Yavapai County (Prescott area) saw its median price dip 7.5% to $472,000, though closed sales there surged nearly 17%, a sign that buyers are showing up as prices come off their peaks.
Rural markets remain thin and volatile
Smaller counties tell a very different story. Apache and Pima counties both saw days on market spike dramatically — 127% and 116% higher than a year ago, respectively — reflecting slower-moving inventory. Graham County’s median jumped 21% to $327,500, but volume remained just 6 sales, making the percentage move statistically fragile. Greenlee and Yuma counties recorded zero closed sales in Q1, pointing to extremely limited MLS activity in those areas.
County Snapshot — Q1 2026
| County |
Median Price |
1-Yr Chg |
Closed Sales |
1-Yr Chg |
Mos. Supply |
| Maricopa |
$470,000 |
-2.1% |
14,310 |
+3.1% |
3.1 |
| Pinal |
$370,000 |
0.0% |
2,325 |
+3.2% |
3.5 |
| Yavapai |
$472,000 |
-7.5% |
616 |
+16.9% |
4.8 |
| Coconino |
$675,000 |
-13.3% |
129 |
+18.3% |
5.7 |
| Cochise |
$275,000 |
+3.0% |
317 |
+6.7% |
3.7 |
| Gila |
$410,000 |
+1.0% |
133 |
+18.8% |
5.2 |
| Navajo |
$350,000 |
-15.7% |
105 |
+1.0% |
8.1 |
| Pima |
$339,625 |
+0.5% |
44 |
-10.2% |
9.5 |
What this means for buyers and sellers
For buyers, the data suggests negotiating room is returning in higher-priced markets, where list price reception rates have slipped slightly below 95%. For sellers, the core Phoenix metro and Pinal County growth corridors remain competitive, with homes selling relatively quickly at close to asking price. The broader takeaway is that Arizona’s housing market in Q1 2026 is stable but stratified — strong where population and jobs concentrate, sluggish at the fringes.
Tags: ARMLS | Arizona | Q1 2026 | Data covers all Arizona counties tracked by the ARMLS / RapidStats platform. Q1 2026 = January–March 2026.
To download the full 37 Page Report please visit: Quarterly Housing Summary by Zip Code - Qtr1 2026
|


or another way