
Categories
STAT Reports, Rent Check, Real Estate Investment, Quarterly Housing SummaryPublished September 29, 2026
August 2026 Phoenix Rental STATS Report

COMMENTARY by ARMLS Staff
Quick Hits
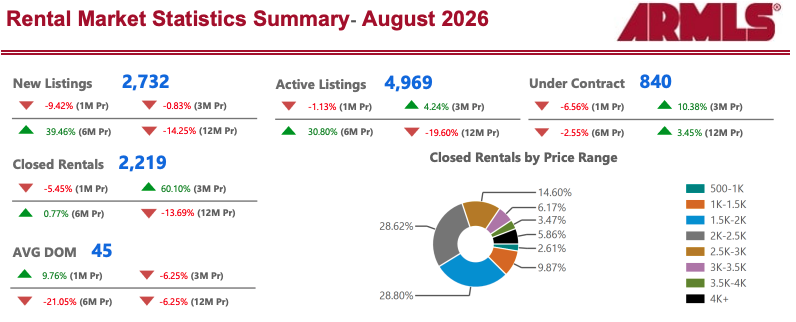
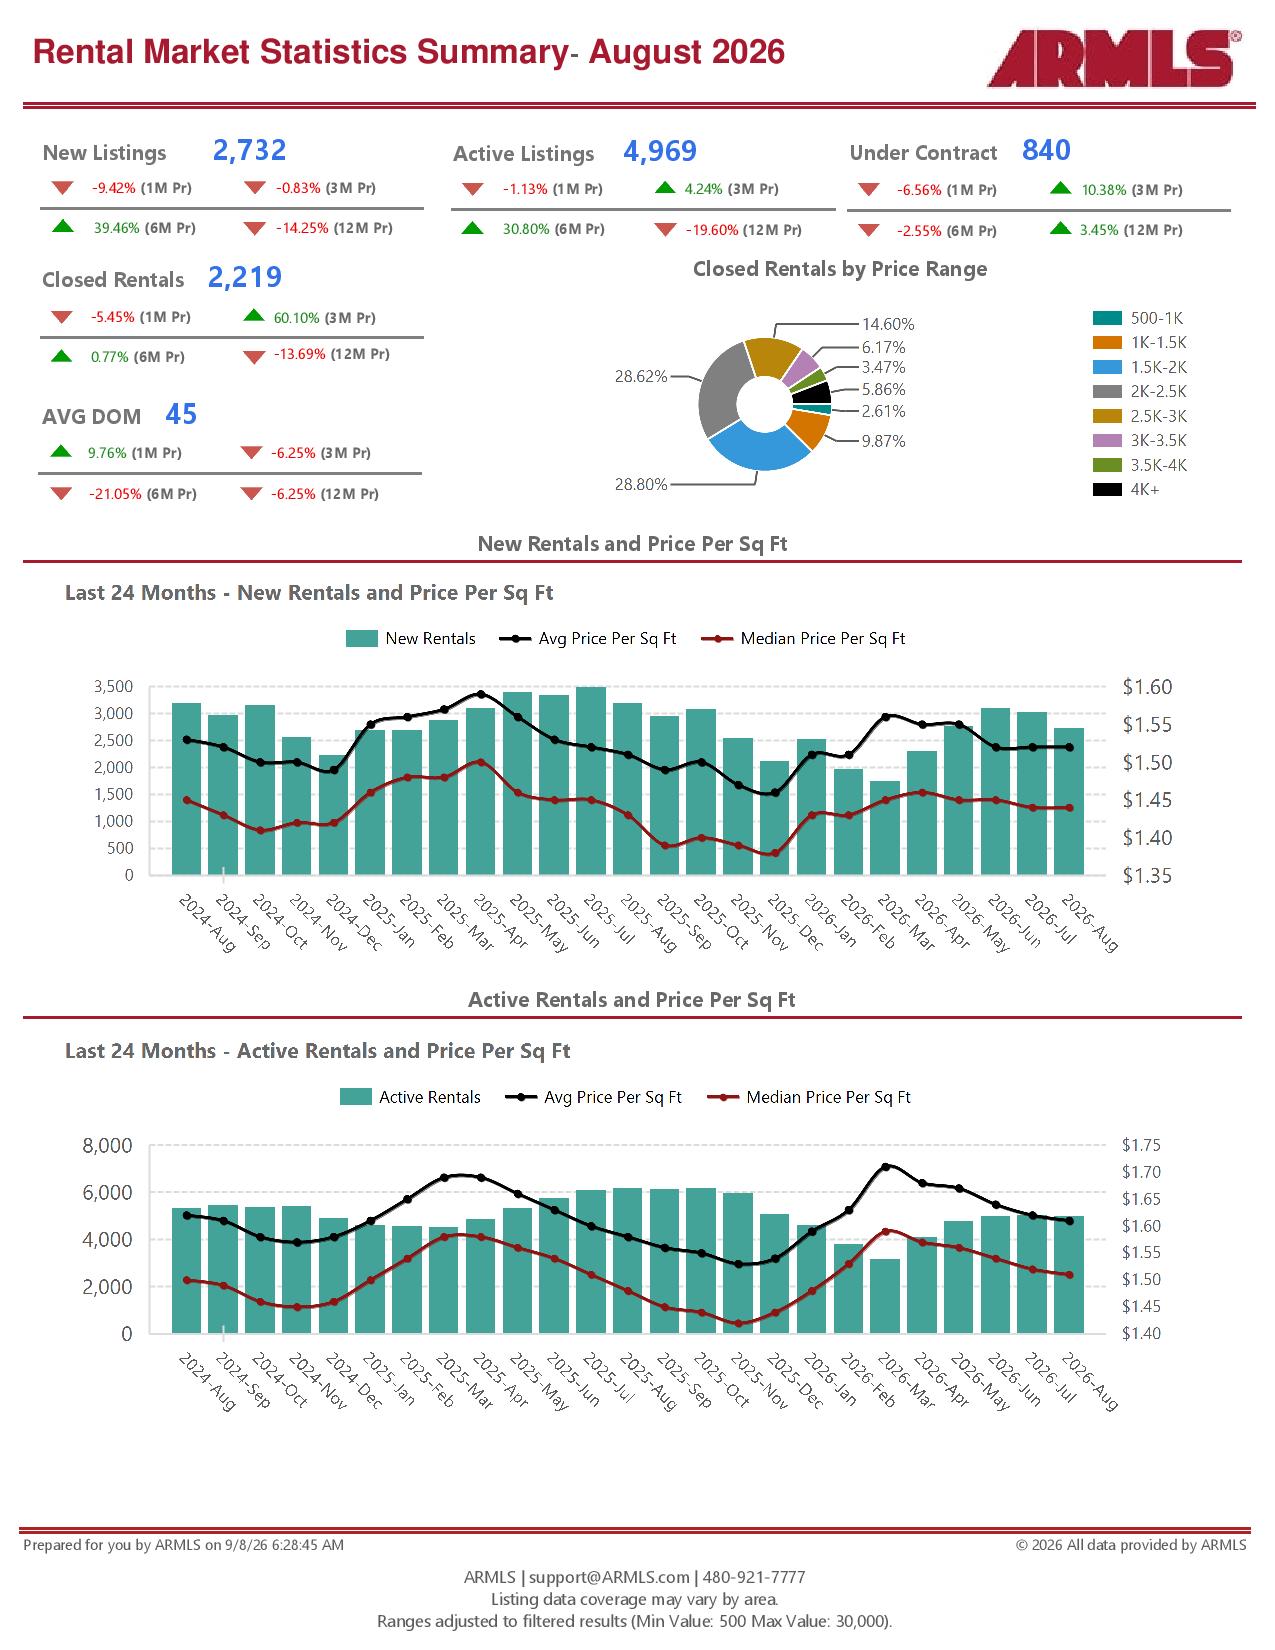
- Active Listings: Inventory dipped slightly by 1.13% month-over-month to 4,969 listings
- New Listings: A total of 2,732 new listings came to market in August
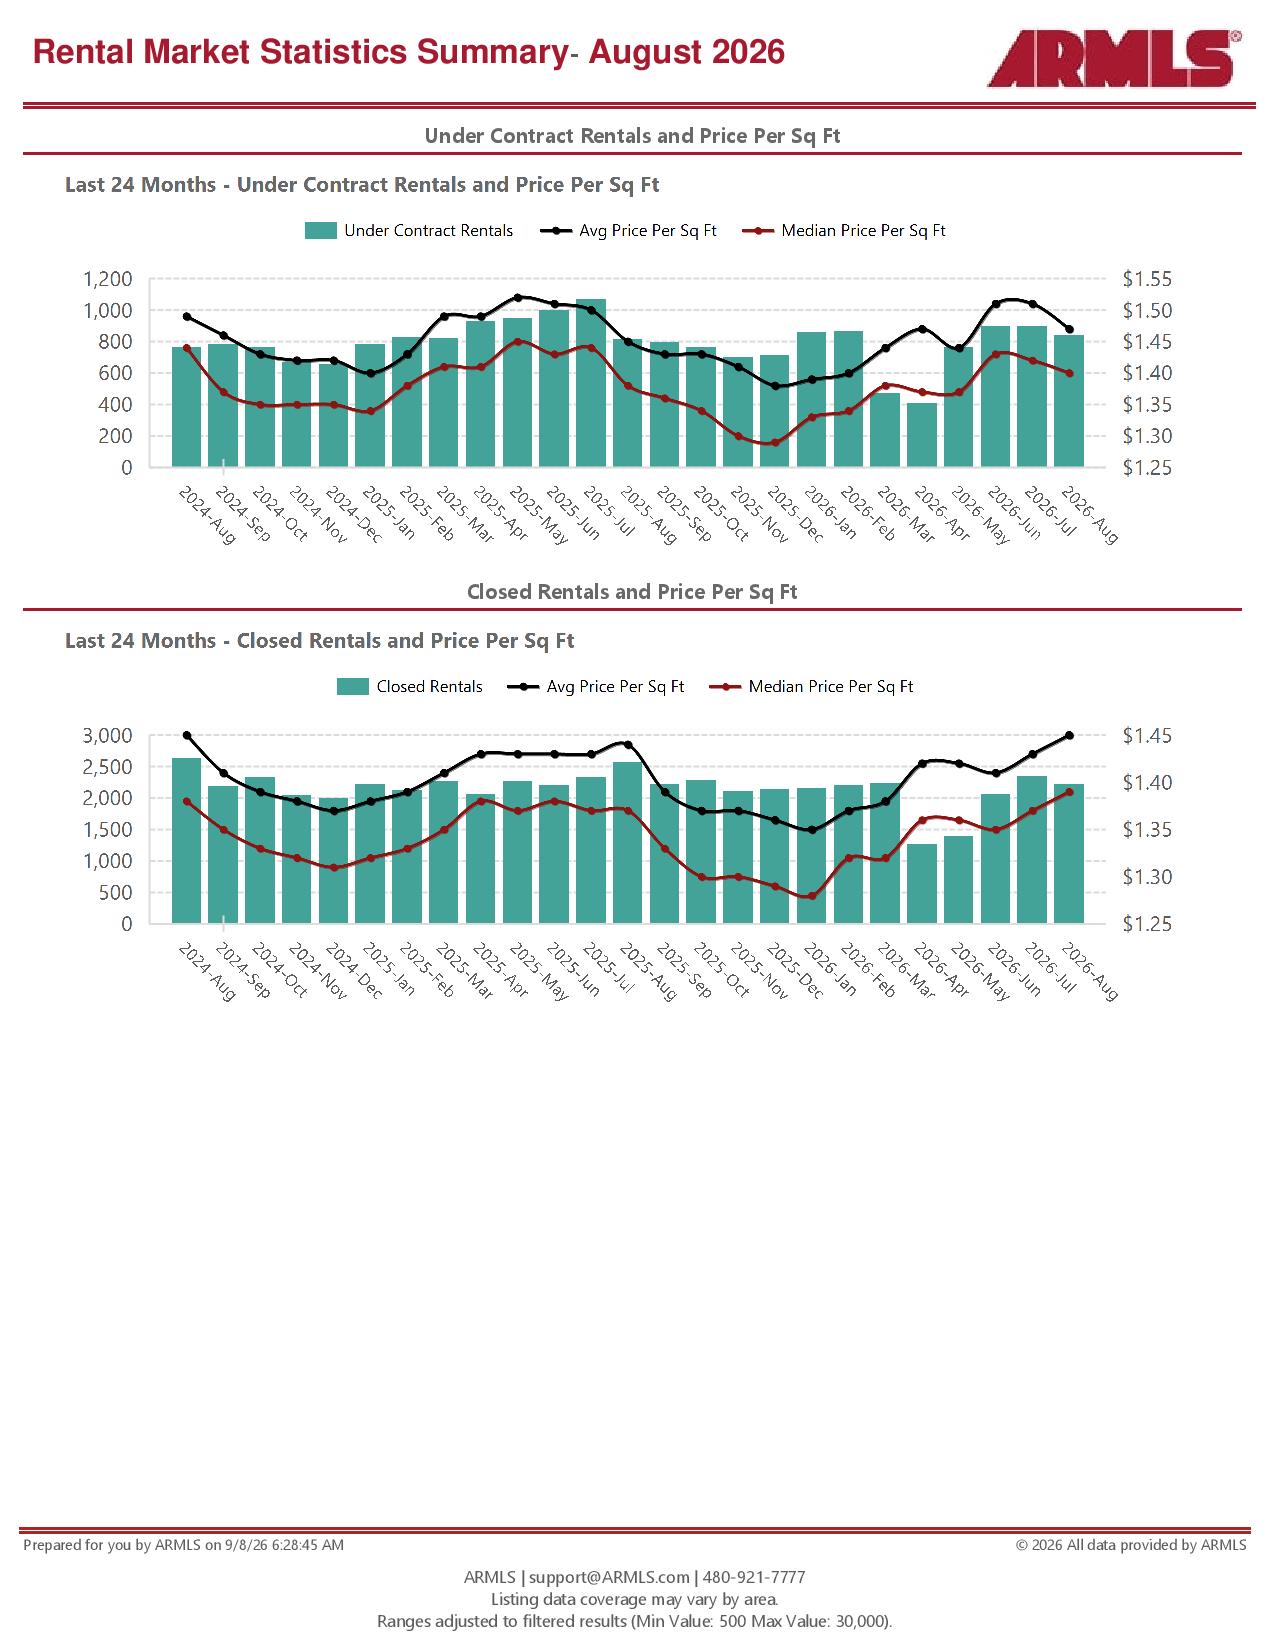
- Closed Rentals: Closed rental transactions fell 5.45% month-over-month to 2,219
- Days on Market (DOM): Average DOM increased 9.76% month-over-month to 45 days
- Under Contract: Properties under contract totaled 840
Market Breakdown: Inventory Adjustments and Pricing Dynamics
The August 2026 rental report reveals a subtle tightening of available inventory alongside mixed pricing signals across different market tiers
New vs. Active Supply
Month-over-month listing activity slowed down across the board
Price Range Distribution
The majority of closed rental activity remains concentrated in mid-tier price ranges
- $1.5K–$2K: Accounts for the largest share of closed transactions at 28.80%
- $2K–$2.5K: Represents 28.62% of all closed rentals
- $1K–$1.5K: Holds 14.60% of the market
- $2.5K–$3K: Captures 9.87% of transactions
- High-end rentals ($3K+) collectively account for just over 12% of closed leases
Months of Supply & Sold-to-List Ratios
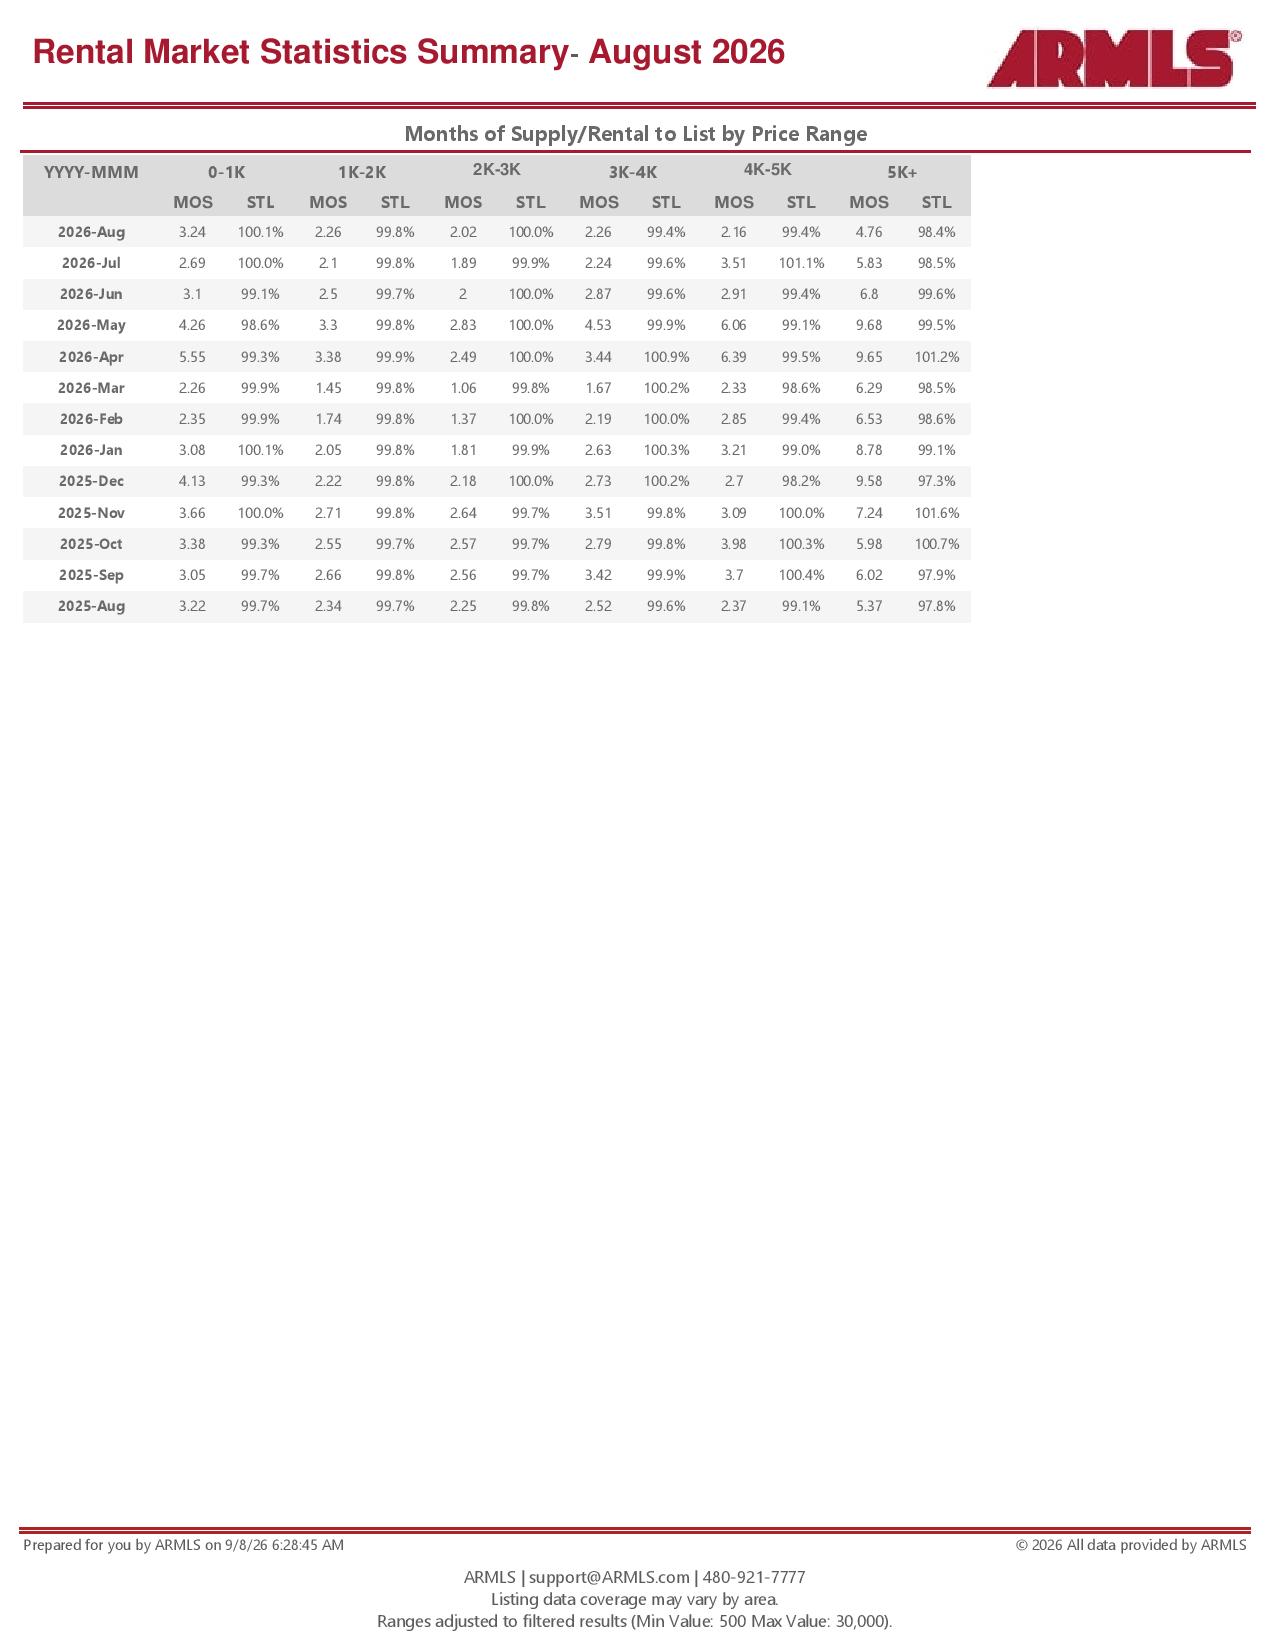
Supply dynamics vary significantly depending on price point:
- Lower-to-mid price tiers ($1K–$3K) maintain tighter conditions, with Months of Supply (MOS) hovering between 2.02 and 2.26 months and sold-to-list (STL) ratios close to 100%
- High-end listings ($5K+) show increased absorption time, with 4.76 Months of Supply and a slightly lower sold-to-list ratio of 98.4%
Takeaway
The rental market is experiencing a mid-to-late summer deceleration in transaction volume and listing growth
For property managers and landlords, competitive pricing in the $1,500–$2,500 range remains the sweet spot for rapid tenant acquisition

Katie Evans
Lead Agent | Katie Evans | Living 48 Real Estate Team
or another way